In February, Dan wrote two excellent pieces explaining the net passing statistic and how the relationship between net passing and goal difference for an individual team can shine light on the importance that team places on dominating possession (we prefer using the net passing metric over possession percentage because it is more fine grained). Net passing is simply the number of passes a team completes over the course of a game less the number their opponent completes. If team B completes more passes in a game than than team A, team A's net passing for the game is negative.
For teams whose tactics are largely centered around ball retention and patient buildup play we expect a strong positive relationship between net passing and goal difference. In other words, as net passing increases for these teams we would expect to see goal difference increase positively.
For teams who prefer to play primarily on the counter, outpossessing the opponent is unimportant. Counterattacking teams want their opponent to have possession and to commit numbers forward so they can break quickly while the opposition is out of position. Counterattacks require fewer passes than slow buildup play from the back. Therefore, for primarily counterattacking teams, we expect no discernible relationship between net passing and goal difference.
Of course, many top level sides use both counterattacking and possession styles based on factors like the style of play of the opposition and whether the game is played at a club's home stadium or an away ground. For instance, we'd expect Manchester United to boss possession in a league game against Stoke at Old Trafford and have a positive net passing value (which they did last Saturday). However, in a Champions League game against Barcelona at the Nou Camp, we'd expect them to keep a compact defensive shape, allow Barca to have the bulk of possession and then look to quickly counter and therefore have a negative net passing value. For these sides, we'd expect a weaker relationship between net passing and goal difference.
Premier League Net Passing 2012-2013
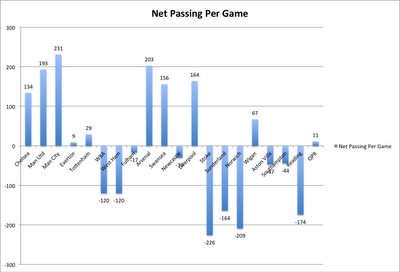
The bar chart below shows the average net passing for each of the Premier League's 20 teams after eight games (Reading and Sunderland have played only seven games). Teams are listed from left to right according to their position in the league table (Chelsea currently sit atop the table while QPR are last). Manchester City, a side with very technical players capable of short intricate passes, have the highest net passing value. They are outpassing their opponents by an average of 231 passes per game. Stoke City, a team that focuses more on physical strength and territory than possession, have the lowest net passing value. They are being outpassed by an average of 226 passes per game.
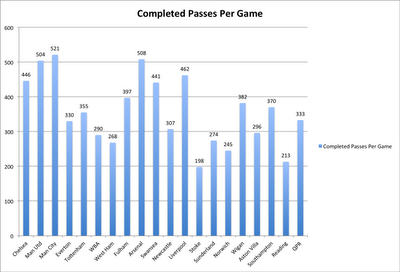
I'm also including this graph of passes completed per game for anyone interested.
Net Passing and League Standing Relationship
While Dan looked at the relationship between net passing and points per game for individual teams, I wanted to look at the relationship between net passing and league standing for all 20 Premier League teams to determine the explanatory power of net passing on league position. If we believed that net passing was the only factor that determined whether a team won or lost a game, we'd expect the team with the highest net passing value to be in first place in the league and the team with the lowest net passing value to be in last. The bars in the net passing bar graph above would get progressively shorter as we moved right from the first place team to the last.
Clearly this is not the case. Manchester City have the highest net passing value yet they are only third in the league. QPR have a positive net passing value but are in last place. Liverpool have the fourth highest net passing value in the league but are still in the bottom half of the table while West Brom and West Ham are 6th and 7th respectively despite having substantial negative net passing values.
The graph shows what we're all well aware of- there are more factors that determine the winner of a soccer game than simply who passes the ball more. For example, in Manchester United's two defeats this season to Everton and Tottenham they outpassed their rivals by 818 passes. Arsenal completed 414 more passes than Norwich last Saturday but were beaten 1-0. Teams have to convert possession into goal scoring opportunities and then have to finish those opportunities. For a number of reasons, it often makes sense for certain teams to employ tactics that aren't focused on ball retention and allow the opposition to control the bulk of possession- it doesn't necessarily mean these teams will finish in the bottom of the league because they have a low net passing value.
The bar graph is interesting however in that it shows of the ten teams that have positive net passing values, seven of them are in the top half of the table. Of the ten with negative net passing values, seven are in the bottom half of the table. That there are more teams with positive net passing values in the top half of the league suggests there may be a relationship between net passing and league position.
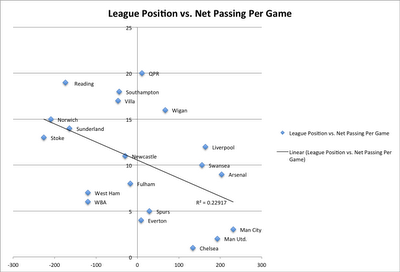
To determine exactly what the explanatory power of net passing on league position is, I plotted league position versus net passing for each of the 20 Premier League teams below. Teams higher up on the y axis are in the bottom half of the league standings and teams further to the left on the x axis have higher negative net passing values. If we believe that higher net passing values improve a team's league standing, we'd expect our trend line to slope down and to the right (indicating that as net passing increases, league position gets closer to first place). Indeed, the trend line is negative. The r^2 value of 0.229 tells us that net passing explains about 23% of the variation in league standing. So although net passing clearly isn't the only factor that determines the winner of a game, it does seem to play a part in determining league position.
The negative slope makes sense. Controlling possession and outpassing your opponent requires a team to have players that are technically gifted (good control and passing ability). Having a lot of technically gifted players also makes a team more likely to win games. Manchester United will always boss possession against a team like Stoke because their players are more technically talented and more often than not they'll beat Stoke because they have superior talent. Because of the superior talent required to play a possession game, it makes sense that top teams also generally have high net passing values.
The analysis however does not determine the subtle difference of whether top teams are top teams because they dominate passing or whether they dominate passing because they are top teams (for a team like Arsenal with a strong emphasis on ball retention regardless of the opponent my guess is the former, for a more tactically more flexible team like Manchester United I'd guess the latter).
Sample Size Issues
The significance of this analysis is limited by the small number of games played in the Premier League thus far. Eighteen teams have played only eight games and two have played only seven. Teams have also not played the same schedules as one another which will also influence net passing and league position. For example, West Ham has only played three games against teams currently in the top half of the table (and lost two) while seven of QPR's eight games have been against teams in the top half. Would QPR and West Ham's net passing and league position look different if their schedules had been swapped? More than likely they would. It would be interesting to do this analysis for the whole of last season. A project for the future perhaps.
For teams whose tactics are largely centered around ball retention and patient buildup play we expect a strong positive relationship between net passing and goal difference. In other words, as net passing increases for these teams we would expect to see goal difference increase positively.
For teams who prefer to play primarily on the counter, outpossessing the opponent is unimportant. Counterattacking teams want their opponent to have possession and to commit numbers forward so they can break quickly while the opposition is out of position. Counterattacks require fewer passes than slow buildup play from the back. Therefore, for primarily counterattacking teams, we expect no discernible relationship between net passing and goal difference.
Of course, many top level sides use both counterattacking and possession styles based on factors like the style of play of the opposition and whether the game is played at a club's home stadium or an away ground. For instance, we'd expect Manchester United to boss possession in a league game against Stoke at Old Trafford and have a positive net passing value (which they did last Saturday). However, in a Champions League game against Barcelona at the Nou Camp, we'd expect them to keep a compact defensive shape, allow Barca to have the bulk of possession and then look to quickly counter and therefore have a negative net passing value. For these sides, we'd expect a weaker relationship between net passing and goal difference.
Premier League Net Passing 2012-2013
The bar chart below shows the average net passing for each of the Premier League's 20 teams after eight games (Reading and Sunderland have played only seven games). Teams are listed from left to right according to their position in the league table (Chelsea currently sit atop the table while QPR are last). Manchester City, a side with very technical players capable of short intricate passes, have the highest net passing value. They are outpassing their opponents by an average of 231 passes per game. Stoke City, a team that focuses more on physical strength and territory than possession, have the lowest net passing value. They are being outpassed by an average of 226 passes per game.
 |
| Click to Enlarge |
I'm also including this graph of passes completed per game for anyone interested.
 |
| Click to Enlarge |
Net Passing and League Standing Relationship
While Dan looked at the relationship between net passing and points per game for individual teams, I wanted to look at the relationship between net passing and league standing for all 20 Premier League teams to determine the explanatory power of net passing on league position. If we believed that net passing was the only factor that determined whether a team won or lost a game, we'd expect the team with the highest net passing value to be in first place in the league and the team with the lowest net passing value to be in last. The bars in the net passing bar graph above would get progressively shorter as we moved right from the first place team to the last.
Clearly this is not the case. Manchester City have the highest net passing value yet they are only third in the league. QPR have a positive net passing value but are in last place. Liverpool have the fourth highest net passing value in the league but are still in the bottom half of the table while West Brom and West Ham are 6th and 7th respectively despite having substantial negative net passing values.
The graph shows what we're all well aware of- there are more factors that determine the winner of a soccer game than simply who passes the ball more. For example, in Manchester United's two defeats this season to Everton and Tottenham they outpassed their rivals by 818 passes. Arsenal completed 414 more passes than Norwich last Saturday but were beaten 1-0. Teams have to convert possession into goal scoring opportunities and then have to finish those opportunities. For a number of reasons, it often makes sense for certain teams to employ tactics that aren't focused on ball retention and allow the opposition to control the bulk of possession- it doesn't necessarily mean these teams will finish in the bottom of the league because they have a low net passing value.
The bar graph is interesting however in that it shows of the ten teams that have positive net passing values, seven of them are in the top half of the table. Of the ten with negative net passing values, seven are in the bottom half of the table. That there are more teams with positive net passing values in the top half of the league suggests there may be a relationship between net passing and league position.
To determine exactly what the explanatory power of net passing on league position is, I plotted league position versus net passing for each of the 20 Premier League teams below. Teams higher up on the y axis are in the bottom half of the league standings and teams further to the left on the x axis have higher negative net passing values. If we believe that higher net passing values improve a team's league standing, we'd expect our trend line to slope down and to the right (indicating that as net passing increases, league position gets closer to first place). Indeed, the trend line is negative. The r^2 value of 0.229 tells us that net passing explains about 23% of the variation in league standing. So although net passing clearly isn't the only factor that determines the winner of a game, it does seem to play a part in determining league position.
 |
| Click to Enlarge |
The negative slope makes sense. Controlling possession and outpassing your opponent requires a team to have players that are technically gifted (good control and passing ability). Having a lot of technically gifted players also makes a team more likely to win games. Manchester United will always boss possession against a team like Stoke because their players are more technically talented and more often than not they'll beat Stoke because they have superior talent. Because of the superior talent required to play a possession game, it makes sense that top teams also generally have high net passing values.
The analysis however does not determine the subtle difference of whether top teams are top teams because they dominate passing or whether they dominate passing because they are top teams (for a team like Arsenal with a strong emphasis on ball retention regardless of the opponent my guess is the former, for a more tactically more flexible team like Manchester United I'd guess the latter).
Sample Size Issues
The significance of this analysis is limited by the small number of games played in the Premier League thus far. Eighteen teams have played only eight games and two have played only seven. Teams have also not played the same schedules as one another which will also influence net passing and league position. For example, West Ham has only played three games against teams currently in the top half of the table (and lost two) while seven of QPR's eight games have been against teams in the top half. Would QPR and West Ham's net passing and league position look different if their schedules had been swapped? More than likely they would. It would be interesting to do this analysis for the whole of last season. A project for the future perhaps.