Goalkeeper distribution trends limited in their ability to predict successful tactics in MLS


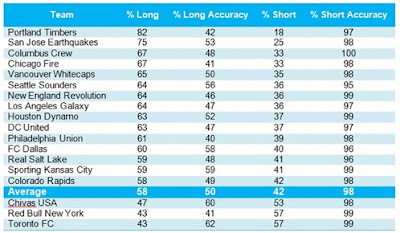
At the end of May, Peter Brownell wrote a blog post for Opta Sports that looked at data on the percentages MLS goalkeepers played the ball long versus short in the 2011 MLS season. The table above is from Brownell's original posting and shows goalkeeper distribution trends from that season for each MLS team. While his data set is interesting, Brownell uses it to arrive at some suspect suggestions about what are the most successful tactics for MLS teams to employ.


He starts off the article noting that American soccer is known for the speed and athleticism of its players over their technical merits on the ball. I'd agree with this point. He uses this bit of information to hypothesize that goalkeepers in MLS will more often than not select to hit long fifty-fifty balls rather than going short and forcing a team to advance the ball with patient buildup from the back.

Indeed, his data backs that hypothesis. MLS goalkeepers elected to play the ball long 58% of the time. Only three teams played the ball short more than long- Chivas USA, Toronto FC, and the New York Red Bulls. He points out that these three teams all had relatively disappointing seasons. Chivas USA and Toronto FC finished in 8th place out of 9 teams in their respective divisions and the New York Red Bulls squeaked into the playoffs in 5th place and were disposed of quickly by the LA Galaxy. Brownell unconvincingly uses these three teams' lack of success to suggest that the best tactics for MLS teams may be to forgo the defense altogether and launch long balls from the goalkeeper. He says,
This suggests, perhaps, that playing out of the back in MLS 2011 might not have been the most fruitful strategy.  One theory to explain this is the idea that MLS players are not technical enough to competently build long, calculated passing sequences.  This is not a slight at the technique of MLS players, but rather trumpets the physically superior MLS rosters.  MLS players are athletes who are fast and fit, bring intense pressure, and close down backs quickly.  As a result, teams like Toronto FC and Red Bull New York turn the ball over in their defensive thirds and give up cheap goals (watch Tim Ream's gaffes against the Philadelphia Union and Real Salt Lake for proof).
By implementing a 4-3-3 and trying to play the beautiful game beautifully, Aaron Winter (Toronto FC's manager) is fighting a losing battle.  The numbers say so at least.  It is easier, safer, and more reliable to forget the backline, smash the ball forward and attempt to win the territorial battle.  Getting big-bodied strikers and midfielders into the box and battling for set-pieces is regarded as ugly soccer, but it can bear results.
Brownell fails however to mention the relative lack of success in the league of teams at the other end of his table, those that elected to play long from the keeper the highest percentage of times. Of the five teams that played the ball long from the keeper the most, only Columbus made the playoffs and they were beaten in the opening round. His suggestion that patient buildup from the back may not be the most fruitful strategy for MLS teams would be much better supported by possession data. While the percentage of balls played long from the keeper may be indicative of the importance a team places on keeping possession, I don't think that stat in and of itself is very telling in explaining a team's success. After all, how many goals begin with moves that start from the goalkeeper? I'd guess that the vast majority of the time goals come from intercepting the ball from the opposition, not from a team's own keeper.

I do think Brownell's data could be put to good use since I believe how often a team plays long from the goalkeeper is a good indicator of how much importance they place on winning the possession battle. It would be interesting to see how Brownell's data correlated to average possession data in MLS and then how average possession data correlated to league success. This information would be more telling of whether direct or possession-style tactics created more successful teams.

MLS wages and performance for 2011

I've had the MLS on my mind as of recently with the 2012 season kicking off tomorrow. Inspired by Simon Kuper and Stefan Szymanski's work on evaluating the best managers in English football, I've put together a simple analysis that attempts to answer the question: which are the best run clubs in the MLS? The idea behind Kuper and Szymanski's analysis is that a team's wage bill explains much of the variation in a team's performance. Thus, managers whose teams consistently perform better than would be predicted by wages are effective managers.

Their analysis is much more thorough than the analysis below, and they focused on managers in the English game. This analysis is focused more on clubs than managers (or coaches), since most MLS coaches have limited control over which players are on their roster. The complex salary cap rules also make interpretation of the MLS data difficult. The figure below displays the cost (in wages) for every 3 points earned in the league. Since a club earns 3 points for each win, it is more simply thought of as the cost per win (or alternatively 3 draws). Clubs that over-perform (i.e., have a low wage bill and perform well) have a low cost per win, while clubs that under-perform (i.e., have a high wage and perform poorly) have a high cost per win. In other words, a shorter bar in the figure below indicates better performance given the level of wages.
Data on points earned are from the MLS, and data on wages are from the MLS Players Union. I use 2011 guaranteed compensation to calculate each club’s wage bill. The wage column in the above figure is in millions of dollars.
As can be seen in the above figure, Seattle has the lowest cost per 3 points earned, as each win cost the Sounders only $161,911 in wages. This suggests that Seattle is an effectively managed club in terms of player personnel decisions (e.g., signing bargain players who are undervalued) and/or tactics and strategy (i.e., getting the most out of the players available). On the other hand, the New York Red Bulls have the highest cost per win, $871,810 in wages, which is over 5 times more costly than Seattle.

It's important not to make too much of the above data. The LA Galaxy had a fantastic season in 2011, and yet, judging by the above metric, they performed poorly. I would argue that the law of diminishing returns applies to soccer in the same way that it applies to most firms. In the context of soccer, at a certain point, each additional good player added to a roster yields a lower return than the player before. For instance, if a soccer club has no good strikers, it probably would reap substantial rewards by signing a top striker. The return on signing a second top striker is also likely quite high (though possibly lower than the first). But, the return on signing a third striker would almost certainly be lower than the second (though it still might be considerable), and signing a fourth striker would likely yield an even lower return than the third. In other words, at some point, the return from each additional dollar spent on the club is lower than the last. So, once the club is past this point, the cost of earning an additional point (our measure of production) increases; this is known as increasing marginal cost.

One method to account for diminishing returns is to use a logarithmic functional form. I replicate my analysis from above, but instead of calculating wages per 3 points earned, I use the natural log of wages, ln(wages), per 3 points earned. Interpreting the actual values for log wages per win is not very intuitive, so I present the rankings using each of the two methods in the table to the left.

Even after taking into account diminishing returns with log wages, Seattle remains atop the rankings. Amazingly, the LA Galaxy jumped 15 spots from 17th based on wages to 2nd based on log wages. New York improved in the rankings, but the Red Bulls only jumped to 12th. Aside from LA and New York, no other team improved more than 2 places. Portland experienced the largest drop in the rankings falling from 4th to 11th, while New England fell 4 places and Chicago and Vancouver each fell 3 places.